Easson2D Software Manual
Browse Easson2D instructions for software setup, machine control, measurement functions, tolerance analysis, program execution, and reporting.
 Quick Start
Learn about software introduction, installation, licensing, interface layout, and basic operations.
View Section → Calibration
Master single-circle, three-circle, auto focus, linear and non-linear compensation methods.
View Section → Machine Control
Control light source, motor, magnifier, and scale readout.
View Section → Vision Measurement
Measure via manual point picking, box selection, edge tracing, auto recognition, and coordinate input.
View Section → Element Construction
Construct distances, intersections, tangents, and auxiliary geometry from points, lines, and circles.
View Section → Coordinate System
Set X/Y axis orientation, translate, rotate, origin shift, and machine coordinates.
View Section → Geometric Tolerance
Evaluate parallelism, perpendicularity, angularity, position, concentricity, and symmetry.
View Section → Labeling
Add and edit horizontal, vertical, aligned, radius, diameter, coordinate, and angle annotations.
View Section → Dimensional Tolerance
Set, modify, and delete single or batch dimensional tolerances.
View Section → Program Recording & Execution
Record, edit, and run measurement programs with array, template matching, and save options.
View Section → Report Output
Select output data and export reports to Excel, Word, or PDF.
View Section → Comparison Objects
Learn the usage and workflow of comparison objects.
View Section → Custom Report
Explore data recording, tables, image-text output, and custom report configuration.
View Section → Smart Navigation
Use the wide-field navigation camera to quickly locate a target area and move the machine to the selected position for precise measurement.
View Section → Probe Measurement
Use a touch probe to acquire workpiece feature positions and perform probe calibration, point/line/circle and other geometric measurements.
View Section → Laser Measurement
Use a laser sensor to acquire surface height and planar position information, and perform calibration, linked point acquisition, and related measurement and analysis.
View Section →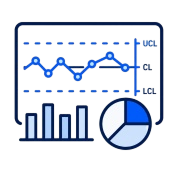 SPC Statistical Analysis
Collect repeated measurement data automatically in SPC Manager and analyze process stability through items, samples, groups, control charts, and statistical indicators.
View Section → Display Customization
Customize units, crosshair, geometry area, element colors, data display, interface layout, and toolbar display.
View Section → Measurement Database
Store, query, and manage measurement records for convenient access to historical measurement data.
View Section →